The Answer to Renewal Reporting

Does your company offer a subscription service or product? If you need to track subscription renewals in SFDC, it can get tricky. What I had to do in the past was, create a report showing assets whose usage end date was approaching, and then create a separate report showing renewal opportunities that were closing within the same date range, and then compare the two reports! But with joined reports, I can see both reports in one place. Here’s how:

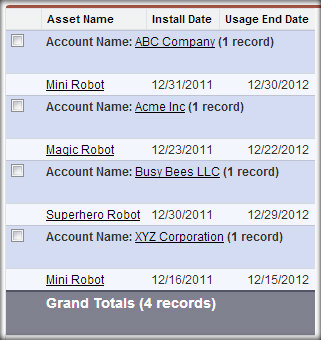
Let’s start with an asset report – I’m keeping it simple – Asset Name, Install Date, Usage End Date, and I’m going to summarize by Account Name. My date range is Usage End Date = This Month, and my report results look like this:

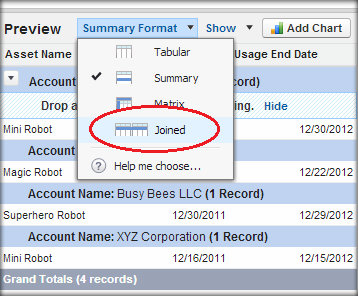
Customize the asset report, then change the report format from Summary to Joined.

Click on “Add Report Type” button at the top of the screen.

Select Opportunities as your report type – it automatically takes you back to the Customize screen, with opportunities listed next to assets (and they are automatically summarized by account name!).

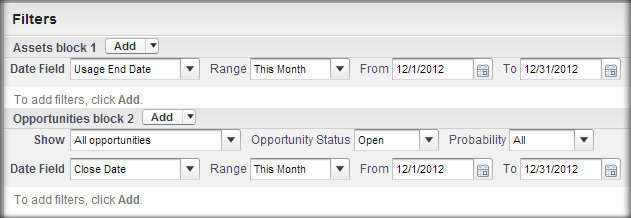
Choose the columns to display on the opportunity side of the report. You will also notice that you now have a 2nd area to set report criteria and a date range – I’m going to filter to only show open renewal opportunities, and I will also make the date range match that of the asset report.

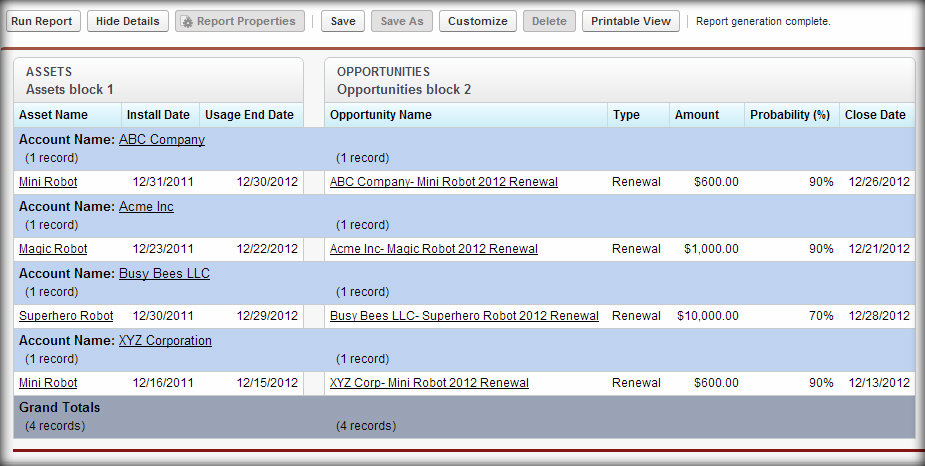
Now when I click Run Report, I have a side-by-side list of Assets expiring this month, and any renewal opportunities with close dates this month. It looks pretty cool, doesn’t it?

Salesforce also offers some other useful types of joined reports here… enjoy!

One Very Handy Trigger

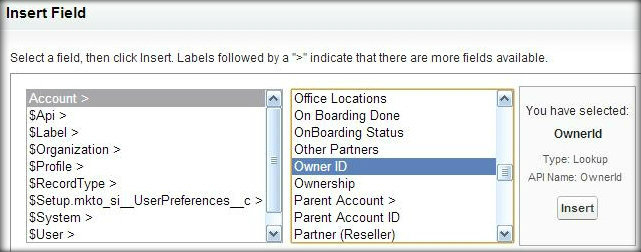
Have you ever created a formula field on a record and attempted to reference information from that record’s owner, such as a custom field that you have on the User object? All you can pull into your formula is the Owner ID! It’s quite the rude awakening, isn’t it?

Formulas cannot transverse the standard owner lookup record, but they can with custom ones – just another of the charming quirks of Salesforce. For those of us who aren’t very fluent in Apex code, this can be pretty unfortunate!

However… there is an easier way to make those custom fields available, and all you need is one trigger. What’s more, it has already been written for you. This is one of the easiest customizations, I have ever done, and I’m no developer. Here’s how to do it:

1) In your sandbox, create a custom Lookup Relationship field on the Account object (I named my custom field “Owner Copy”). Relate it to the User object.

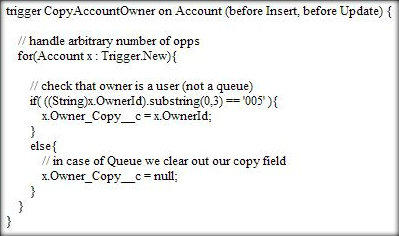
2) Also in your sandbox, create a new Trigger on the Account object. Use this code, substituting the name of your custom field for Owner Copy:

3) Use outbound and inbound change sets to deploy your custom field and your trigger to your production instance.

You’ve now made a field that is just a copy of the account owner, and created a trigger to map the owner’s name to that field. After mapping, a separate formula field can be used on your custom field to move up the user record and pull whatever information is needed (generally role name information or custom user object fields, but it can be used for anything including alerting delegated approvals or managers, etc).

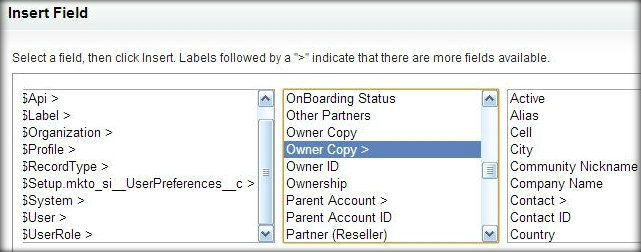
So now when I go to create my formula field, I can access all of the fields that exist in the Account owner’s User record:

Note: You can also create this trigger for other objects. Just replace ‘Account’ with whatever object you prefer (Lead, Contact, Opportunity).

Lastly, I’m very lucky to have a friend who is generous with his advice and incredible knowledge of Salesforce – so I need to say thanks Gabe!! (a.k.a. John Gabriel Athitakis) This trigger saved me a lot of grief. I hope it can do the same for my readers.

Want the coolest summary reports on the block?

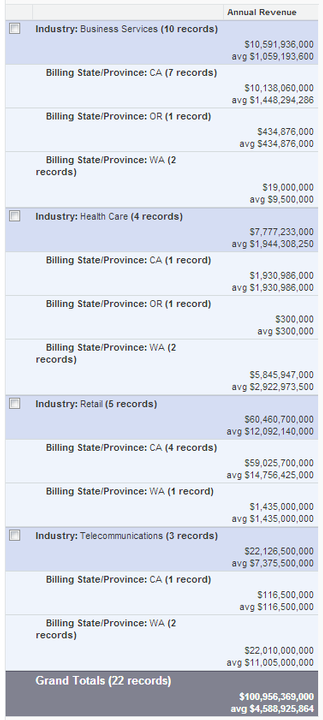
I love a good summary report. Honestly, I don’t even remember the last time that I ran a tabular report – because there’s always something worth summarizing. But sometimes, you just want a little more. For instance, take this report – I know it’s a tiny picture, but you get the idea…

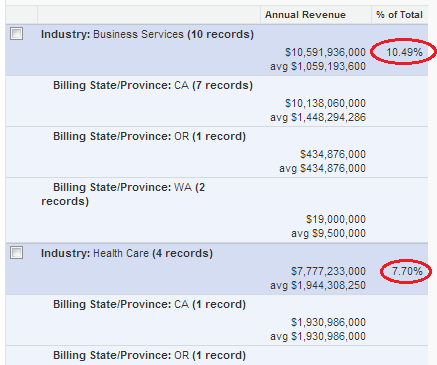
This report takes the annual revenue of my accounts (for this example I used the West coast states), and gives me totals summarized by industry and by state. I also added averages because Salesforce reports are cool like that. This report is really fine and dandy as it is. But… what if I wanted to know how much each industry contributed to the grand total, percentage-wise? Thanks to the PARENTGROUPVAL function, I can create some great formula columns that will take this report to a whole ‘nother level. (Note: the 2nd half of this Dreamforce session is all about that function.)

For this example, I’m taking my report that is summarized by industry and then by billing state (you can do it by region instead of state if you have regions in your accounts).

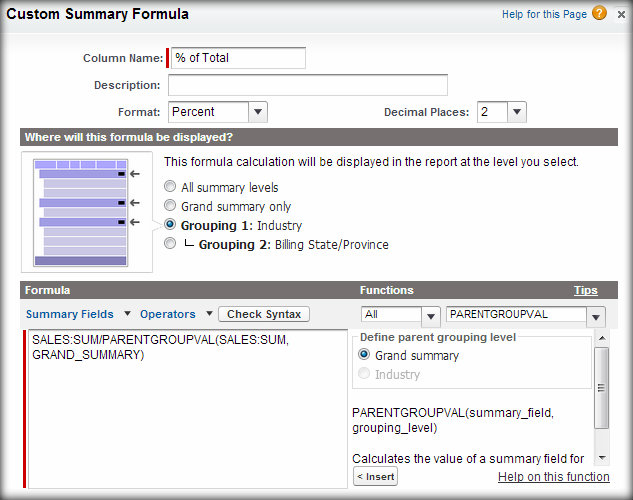
  • Customize your report, and under Fields over on the left, double click on Add Formula. Give your formula a name – mine was “% of Total.” Select the format “Percent” and specify how many decimal places to display. In the options for where to display your formula, select “Grouping 1: Industry”
  • In the formula box: from the Summary Fields list, select Annual Revenue > Sum
  • Enter ” /
  • From the Functions list, select PARENTGROUPVAL, ensure the Grand Summaryradio button is selected, and click < Insert
  • In the function that you have just inserted, highlight the text that says summary_field– then from the Summary Fields list, select Annual Revenue > Sum to replace the highlighted text

This is what your formula should look like… then click OK.

Now your report is so much more interesting!

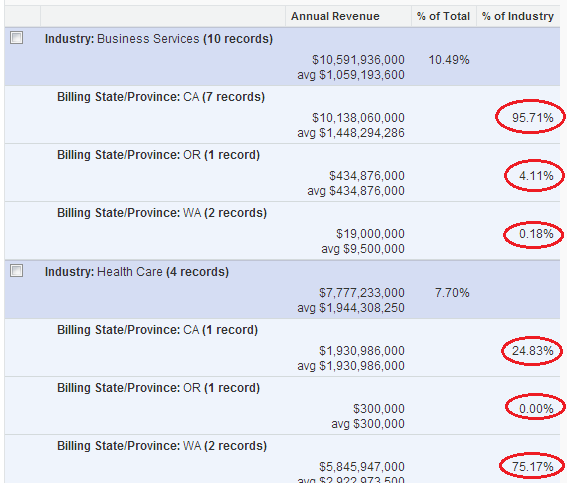
Is that enough? Maybe. But… what if I wanted to know how much each state contributed to the grand total of each industry? Let’s create another formula column!

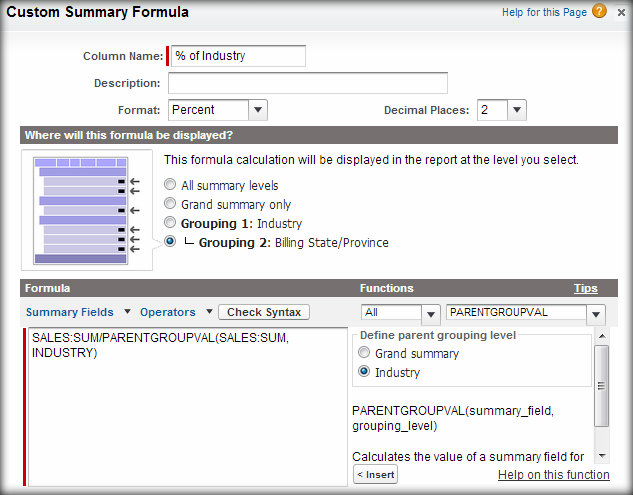
  • Customize your report, and under Fields over on the left, double click on Add Formula. Give your formula a name – mine was “% of Industry.” Select the format “Percent” and specify how many decimal places to display. In the options for where to display your formula, select “Grouping 2: Billing State/Province” (or whatever you are using for your 2nd summary field)
  • In the formula box: from the Summary Fields list, select Annual Revenue > Sum
  • Enter ” /
  • From the Functions list, select PARENTGROUPVAL, ensure the Industry radio button is selected, and click < Insert
  • In the function that you have just inserted, highlight the text that says summary_field– then from the Summary Fields list, select Annual Revenue > Sum to replace the highlighted text

This is what your formula should look like… then click OK.

How cool is that report now? Look at all of the additional information you can pull from it… without a calculator!

Try it out… and let me know how it works for you.

The Magic of a “Moving Average” Report

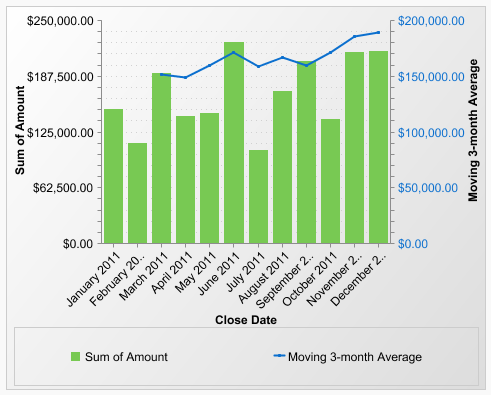
Identifying sales trends can be complicated, particularly if your company’s sales totals vary drastically from week to week, month to month, etc. Have you ever wanted to look at sales figures in a report, and also get an average per week/month/quarter of those figures? I once had that issue with a particular product line – one month might seem slow, but without doing a lot of manual calculation, there was no way of knowing how far from the average that month really was. And then… I attended an awesome reporting session at Dreamforce – feel free to watch the recording before you try this at home – and finally learned how the PREVGROUPVAL function works! Here’s how to add moving average information to a report, with a nifty combination chart as well.

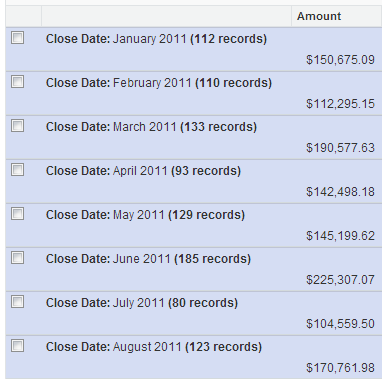
1. Start with a report that is summarized by date – mine was summarized by calendar month. With details hidden, it looked like this:

Well that’s just fine – but what if I wanted to see what the average per month was – say, every three months? I’d have to get a calculator and figure that out for each 3-month period in my report. No thank you!

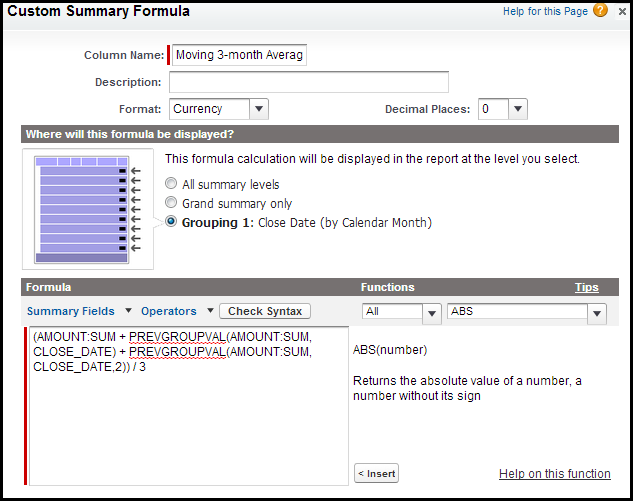
2. Customize your report, and under Fields over on the left, double click on Add Formula. Give your formula a name – mine was “Moving 3-month Average.” Select the format “Currency” and specify how many decimal places to display. In the options for where to display your formula, select “Grouping 1: Close Date.”

Then you will want to write your formula. The formula section has tools that will insert fields and functions for you. Follow these steps:

  • Start with “ (
  • From the Summary Fields list, select Amount > Sum
  • Enter “ +
  • From the Functions list, select PREVGROUPVAL, and click < Insert
  • In the function that you have just inserted, highlight the text that says summary_field – then from the Summary Fields list, select Amount > Sum to replace the highlighted text
  • At the end of the formula, enter “ +
  • From the Functions list, select PREVGROUPVAL, and click < Insert
  • In the function that you have just inserted, highlight the text that says summary_field – then from the Summary Fields list, select Amount > Sum to replace the highlighted text
  • In the function that you have just inserted, click after “CLOSE_DATE” and enter “,2
  • At the end of the formula, enter “ ) / 3

Check the screenshot below to make sure your formula matches… then click OK.

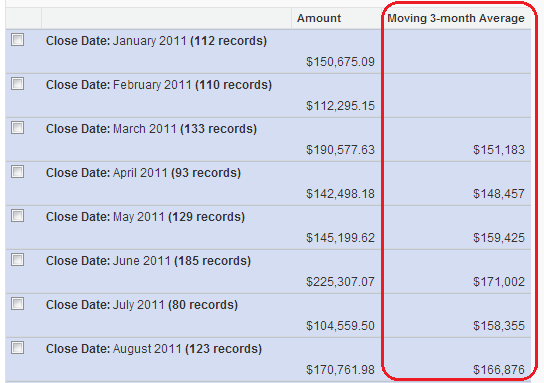
If you run your report now, it will look like this:

The reason the first two rows do not have a Moving 3-month Average is, they do not have two previous rows to average their amounts with (the formula takes the current month, adds the two previous months, and returns an average of the three of them).

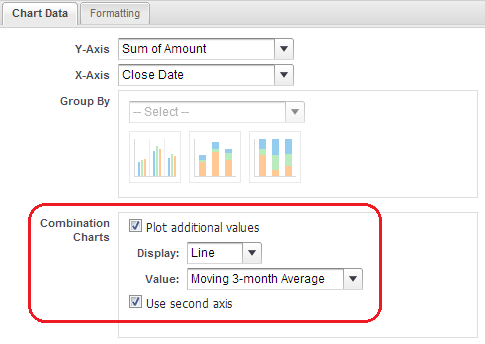
3. Now if you’d like to add a chart, go back into Customize and click Add Chart (or Edit Chart) if you already have one. This works best with a vertical bar chart. On the Chart Data tab, check the “Combination Charts” box and fill in the information as pictured below, then click OK. (Hint: you may also want to go to the Formatting tab and change the Legend Position to Bottom.)

Voila! Your chart will look something like this:

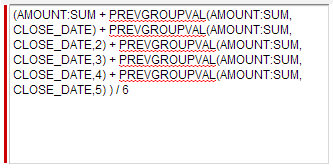
One more tip: Let’s say you wanted more than 3 time periods in your formula. You can just keep repeating the process until you have as many AMOUNT: SUM calculations as you like. For instance, if I wanted a moving 6-month average, my formula would look like this: