I love a good summary report. Honestly, I don’t even remember the last time that I ran a tabular report – because there’s always something worth summarizing. But sometimes, you just want a little more. For instance, take this report – I know it’s a tiny picture, but you get the idea…
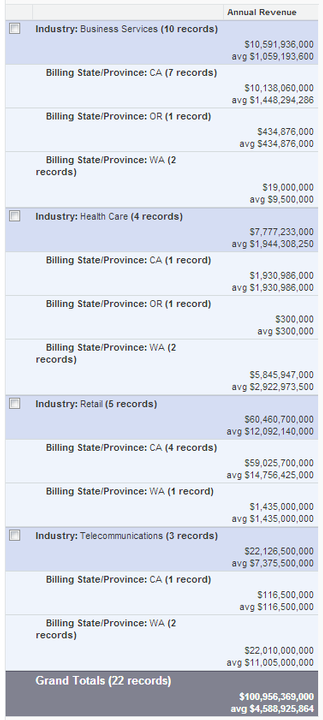
This report takes the annual revenue of my accounts (for this example I used the West coast states), and gives me totals summarized by industry and by state. I also added averages because Salesforce reports are cool like that. This report is really fine and dandy as it is. But… what if I wanted to know how much each industry contributed to the grand total, percentage-wise? Thanks to the PARENTGROUPVAL function, I can create some great formula columns that will take this report to a whole ‘nother level. (Note: the 2nd half of this Dreamforce session is all about that function.)
For this example, I’m taking my report that is summarized by industry and then by billing state (you can do it by region instead of state if you have regions in your accounts).
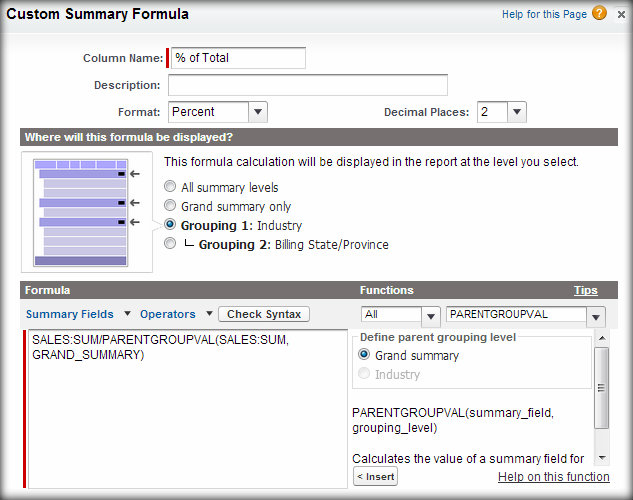
- Customize your report, and under Fields over on the left, double click on Add Formula. Give your formula a name – mine was “% of Total.” Select the format “Percent” and specify how many decimal places to display. In the options for where to display your formula, select “Grouping 1: Industry”
- In the formula box: from the Summary Fields list, select Annual Revenue > Sum
- Enter ” / “
- From the Functions list, select PARENTGROUPVAL, ensure the Grand Summaryradio button is selected, and click < Insert
- In the function that you have just inserted, highlight the text that says summary_field– then from the Summary Fields list, select Annual Revenue > Sum to replace the highlighted text
This is what your formula should look like… then click OK.
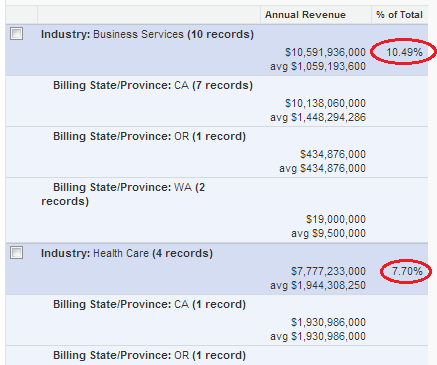
Now your report is so much more interesting!
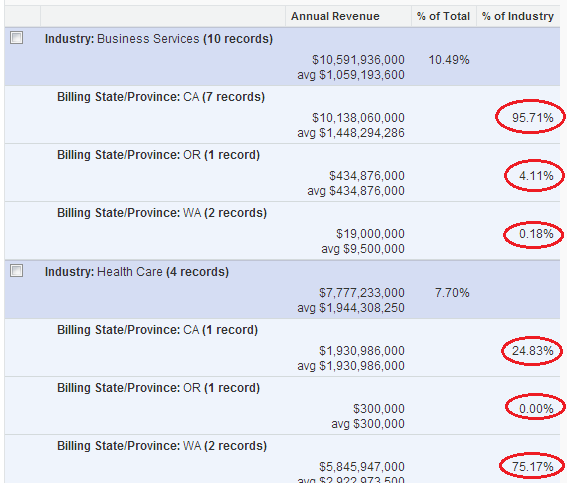
Is that enough? Maybe. But… what if I wanted to know how much each state contributed to the grand total of each industry? Let’s create another formula column!
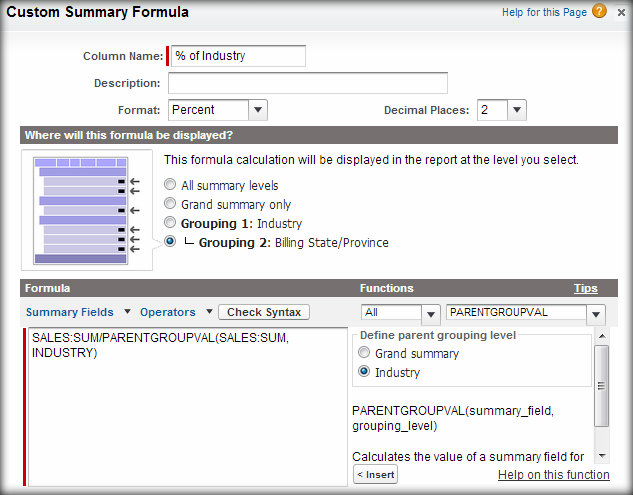
- Customize your report, and under Fields over on the left, double click on Add Formula. Give your formula a name – mine was “% of Industry.” Select the format “Percent” and specify how many decimal places to display. In the options for where to display your formula, select “Grouping 2: Billing State/Province” (or whatever you are using for your 2nd summary field)
- In the formula box: from the Summary Fields list, select Annual Revenue > Sum
- Enter ” / “
- From the Functions list, select PARENTGROUPVAL, ensure the Industry radio button is selected, and click < Insert
- In the function that you have just inserted, highlight the text that says summary_field– then from the Summary Fields list, select Annual Revenue > Sum to replace the highlighted text
This is what your formula should look like… then click OK.
How cool is that report now? Look at all of the additional information you can pull from it… without a calculator!
Try it out… and let me know how it works for you.
Liked this post? Follow this blog to get more.
