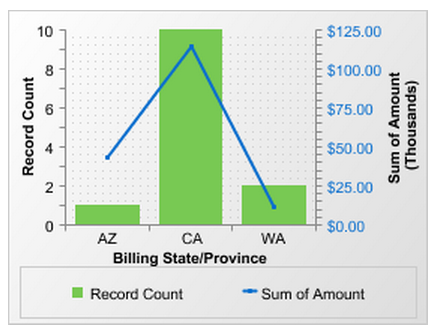
I used to create separate dashboard components for opportunity amount totals and for number of opportunities in the pipeline – until I discovered the combination chart. Not only does it give you both record count and dollar amount totals (saving space on the dashboard), it looks really cool! If you want to create one, it’s easy – follow my instructions below.

CREATE A SOURCE REPORT. For my combo chart, I’ve used an opportunity report, summarized by state, and specified a particular grouping of states in my report to represent a territory. You can do this based on opportunity owner, type, region, or any field that you use in your accounts or opportunities. Be sure that you summarize the opportunity amount in the Amount column.
ADD THE CHART TO YOUR REPORT. This step is important because you cannot create a combination chart at the dashboard level. Follow these guidelines to create the chart:
- Click Customize on your report.
- Click the Add Chart button.
- In the Chart Editor, choose the vertical column chart type (at the top).
- For the Y-Axis, select Record Count.
- For the X-Axis, select the field that you used to summarize your report – in my example, it’s the Account Billing State/Province field.
- Check the Plot additional values box where it says Combination Charts.
- For Display, select Line.
- Check the Use second axis box.
- For Value, select Sum of Amount.
- Optional: go to the Formatting tab and move the Legend Position from Right to Bottom – it tends to take up too much space to the right of the chart. You can also customize the look of the chart on this tab.
- Click OK and then save your report.
ADD THE COMPONENT TO YOUR DASHBOARD. On your dashboard, drag the vertical column component into the dashboard area. For your Data Source, select the report you just created. Go into the component edit screen – at the top left is a checkbox labeled Use chart as defined in source report. Check this box, click OK, and save your dashboard. Ta-da! Now you have opportunity record totals and amount totals all in one chart.
